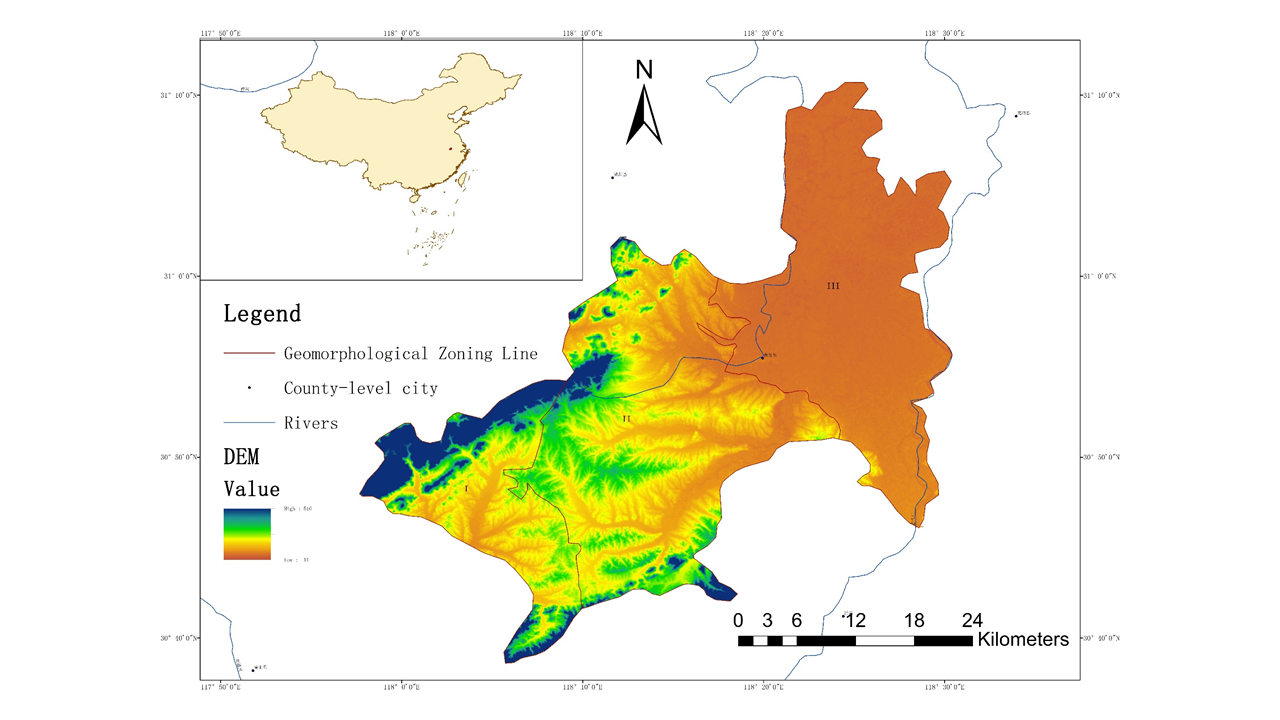
Nan Ling commodity grain base is a national high-standard farmland demonstration area. Scientific evaluation of soil environmental quality is of important significance to plan land resources rationally to improve the quality and efficiency of agricultural production. This paper try to apply the Radar Chart–a visual graphic data analysis method–to the assessment of soil environmental quality. In the assessment, a new idea was introduced that area and perimeter of radar chart represents the soil environmental quality and the difference between the qualities of the soil environmental quality indicators respectively. Different from the other assessment methods,the Radar Chart method transforms data into graphics and through an intensive analysis of graphics, the data information can be retained and excavated more fully. It was proved through this case study that the application of Radar Chart method to the assessment of soil environmental quality is feasible and it is more intuitive, efficient, comprehensive and fine. The results indicated that the soil environmental quality at depth of 0-60cm in low mountain area of Nan ling commodity grain base is the second grade while that in the hilly and plain area are both the first grade. The indicators of poor soil environmental quality in low mountain area are Cd and As, those in hilly area are Cd、As and Hg, and that in plain area is Cd; The difference between the qualities of the soil environmental indicators in low mountain area is more significant than that in hilly area and plain area.