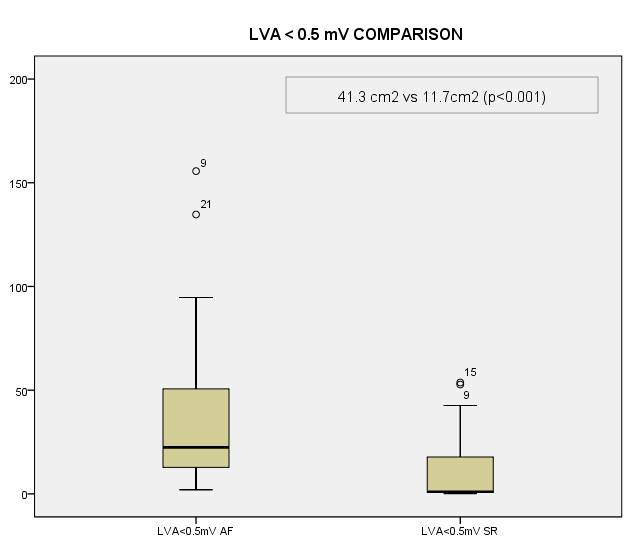
Aims Atrial fibrosis can promote atrial fibrillation (AF). Electroanatomic mapping (EAM) can provide information regarding local voltage abnormalities that may be used as a surrogate marker for fibrosis. Specific voltage cut-off values have been reproducibly shown to accurately identify fibrosis in the ventricles but they are not well defined in atrial tissue. Methods Unicenter prospective study. Consecutive patients with persistent AF referred for ablation were included. EAM was performed with Carto3 mapping system (Biosense Webster, Inc.). We recorded bipolar signals, first in AF and later in sinus rhythm (SR) after electrical cardioversion. Two thresholds delimited low-voltage areas (LVA): 0.5 and 0.3mV. We compared LVA extension between maps in SR and AF in each patient. Results 23 patients were included. Percentage of points with voltage lower than 0.5mV and 0.3 mV was significantly higher in maps in AF compared to maps in SR: 38.2% of points <0.5mV in AF vs. 22.9% of points <0.5mV in SR (p<0.001); 22.3% of points <0.3mV in AF vs. 14% of points <0.3mV in SR (p<0.001). Areas with reduced voltage were significantly bigger in maps in AF (0.5mV threshold, mean area in AF 41.3cm2 ± 42.5cm2 vs 11.7cm2 ±17.9cm2 in SR, p <0.001; 0.3mV threshold, mean area in AF 15.6cm2 ±22.1cm2 vs 6.2cm2 ±11.5cm2 in SR, p <0.001). Conclusion Using the same voltage thresholds, LVA extension in AF is greater than in SR in patients with persistent AF. These findings provide arguments for defining a different atrial fibrosis threshold based on EAM rhythm.